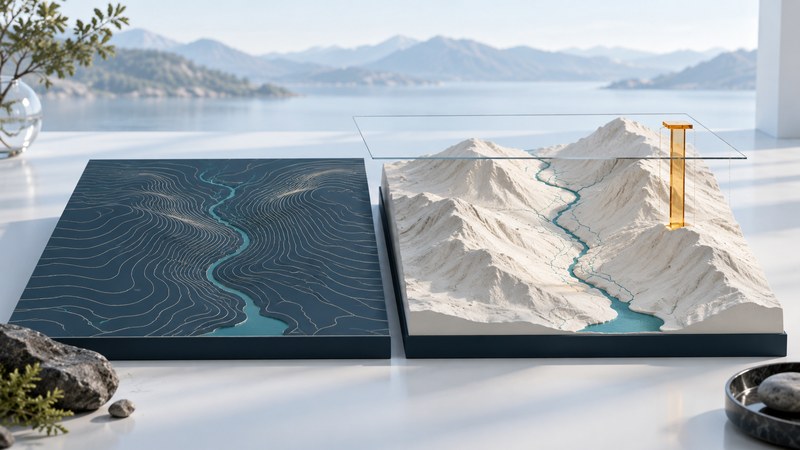
A 3D map helps you see how a ridge, valley, building, or route fits into its surroundings. The most useful habit is to move between an oblique view that reveals shape and a top-down view that makes positions easier to compare. Treat the scene as a view of geographic data, with a source and a scale, rather than as a photograph of everything currently on the ground.
Change one part of the view at a time
Begin with a place you can identify in an ordinary map. Keep a recognizable feature, such as a river bend or road junction, near the center while changing the camera. If you become disoriented, return to north-up and a near-vertical view before continuing.
| Control | What changes | Useful check |
|---|---|---|
| Pan | The area at the center of the view | Keep the same reference feature visible as you move to a neighboring slope. |
| Zoom | The amount of territory in view | Wait for the available detail to load; enlarging a scene does not create new measurements. |
| Rotate | The direction from which you look | Check the north indicator before describing left or right as east or west. |
| Tilt | The angle between overhead and oblique viewing | Compare with overhead viewing when a ridge hides the valley beyond it. |
A free place to practice is the Swiss federal 3D map viewer. Swisstopo describes its scene as terrain combined with buildings and other objects. Search for a named place, switch into 3D, and use the navigation controls provided for your mouse, touchpad, or touchscreen. Keep its help available because gestures differ among viewers.
Ask what gives the scene its height
Aerial imagery supplies visible surface detail; an elevation model supplies height. Buildings, bridges, or trees may be separate objects. A convincing scene can combine layers collected at different times, so an apparent mismatch between a roof image and a building model deserves a source check.
The USGS definition of a digital elevation model describes its bare-earth representation as excluding trees, buildings, and other surface objects. Product terminology can vary, so read the description of the layer you actually use. For terrain interpretation, establish whether heights refer to bare ground, a surface including objects, or a combination of layers.
Vertical exaggeration increases displayed relief relative to horizontal distance. It can make subtle terrain easier to see. Esri’s elevation-surface documentation explains this as a drawing property and notes that it applies to the selected elevation surface, not automatically to every other layer. Record any exaggeration before judging how steep a slope looks.
Illustrative calculation: a valley floor at 400 metres and a ridge at 600 metres have 200 metres of relief. At 3× vertical exaggeration, the displayed separation corresponds to 600 metres relative to the unchanged horizontal scale. The elevation data still describe 200 metres of relief. Exaggeration is a presentation choice.
Work through a valley in four views
For a real location, try the Simplon corridor. Start near Brig and follow the surface road toward Simplonpass. You can use the same sequence for another well-mapped valley.
- Overhead: identify the road, stream, and nearby contours. Note the map’s north direction and choose two recognizable points.
- Oblique from one side: lower the viewing angle until the slopes are clear. Notice which parts of the road become hidden behind terrain.
- Oblique from the opposite side: rotate around the same area. If a feature reappears, its earlier absence was caused by the viewpoint.
- Overhead again: check the relationship against contours and labels. Use a measurement tool with a stated distance definition for any numerical claim.
The result should be a geographic observation, such as “the road bends around a steep side slope before reaching higher ground.” It should also identify the evidence: contour spacing, the visible road alignment, and the two viewing directions. A screenshot alone leaves those choices implicit.
Keep distance types separate. A horizontal measurement describes separation in plan view; a terrain-following distance can include the ups and downs of the ground. Screen pixels in an oblique view have no single uniform ground scale across the image. Use the viewer’s measurement documentation rather than measuring a screenshot with a ruler.
Save a view someone else can interpret
Record the place, source link, viewing date, active layers, elevation units, height reference if supplied, and any exaggeration. Include the viewing direction when it affects the conclusion. Swisstopo’s viewer supports sharing a selected view by URL; retain a short explanation with that link.
Use the 3D view comparison notes to record your observation and the check that supports it. If a feature stays uncertain, name the missing evidence: finer elevation data, newer imagery, a layer description, or a different viewpoint. This turns a visually persuasive scene into a reproducible comparison.
Related reading
- Aerial mapping imagery: Check how photographs are corrected to fit a map coordinate system.
- Goma and Nyiragongo: Apply terrain reading to a city, volcano, lake, and dated eruption map.
- Isla Calafia: Separate measured seabed relief from a reconstructed shoreline.